Computational and Experimental Study on Electronic Band Structure of Bismuth Ferrite: A Promising Visible Light Photocatalyst
Article information
Abstract
Abstracts
Electronic band structure of bismuth ferrite (BFO) is studied by computational and experimental methods. Bandgap of BFO is precisely determined using optical absorption spectra as well as density functional calculation (DFT). Both methods give a comparable result that BFO can have both of direct or indirect (very close to direct) bandgap of about 2.0∼2.2 eV. Furthermore, electronic transition in BFO occurs via the unoccupied O 2p to the occupied Fe 3d states or the d-d transition in Fe 3d states. Intriguing electronic structure of BFO, a narrow bandgap and a multiple electronic transition route, render it as a promising candidate for a visible light photocatalyst.
Introduction
Photoelectrochemical water platting is a one of promising way to produce sustainable energy without forming any greenhouse gases.[1] The solar energy can be directly converted to chemical energy such as hydrogen (H2) by photocatalysis of water. Semiconductor metal oxides have been widely studied as an active photoanode for photoelectrochemical water splitting due to their optimal band structure and electrochemical robustness in harsh electrolyte conditions. [2] Generally, a narrow bandgap with an appropriate band positon is favorable for semiconductor metal oxides to effectively absorb visible light and split water.
Bismuth ferrite (BiFeO3, BFO) has attracted a great attention from researchers owing to attractive electronic and magnetic properties. [3, 4] It was reported that BFO has a narrow direct bandgap of around 2.2 eV and is responsive to visible-light for photocatalytic water splitting. [5] However, several discrepancies were found in the literature regarding with the electronic band structure of BFO, especially between computational and experimental results. [6,7] Difference values for the bandgap of BFO were reported.[8] Moreover, although the ferroelectric properties of BFO with the polarizable electronic configuration of Bi3+ can enhance its photocatalytic activity, this gives difficulty to experimentally study a detailed electronic band structure of BFO. Thus, combined approach using computational as well as experimental methods is necessary to accurately investigate the electronic band structure of BFO.
In this work, we have prepared BFO via a facile sol-gel method and analyze its optical and electronic properties by measuring absorption spectra. Also, computational simulations were performed on the modeled BFO to precisely calculate electronic band structure of BFO. Our results reveal that BFO can have a direct or indirect (very close to direct) bandgap with a value of about 2.0 ∼ 2.2 eV. Moreover, electronic transitions in BFO can be occurred via a two different routes either from the occupied O 2P to the unoccupied F 3d states or the d-d transition in Fe 3d states. Experimental and computational results for electronic structure of BFO were in good agreement each other. A narrow bandgap of BFO with a multiple electronic transition route highlights a potential use of BFO as an active visible light photocatalyst for water splitting.
Experimental Procedures
Synthesis and characterization: The BFO was synthesized using a facile sol-gel route. Typically, Bi(NO3)3·6H2 O and Fe(NO3)3·9H2 O in a stoichiometry ratio (1:2) were dissolved in ethylene glycol by continuous stirring at 80°C for 30 min. Then the reaction was carried out at 70°C for 10 h to get a gel. Then gel was heated in a muffle furnace at 400°C for 2 h followed by annealing at 550°C for 1hr in a ramp rate 5°C/min. Finally the powder was collected by repeated washing with ethanol and water and dried at 60°C for overnight. Crystal structure of the BiFeO3 were refined from powder X-ray diffractometer (Malvern Panalytical X’Pert³ Powder).We used Fullprof as a refinement tool for XRD patterns. Chi-square value as set to 2.75. In addition, these refined structures optimized by the wien2k 2D optimization code. The UV− vis spectrum of BFO powder was recorded using a JASCO UV Visible Spectrophotometer (V-670 PC).
Computational methods: First principles calculation of ferromagnetic R3c BiFeO3 executed using full potential linearized augmented plane wave (FP-LAPW) method. This density functional theory (DFT) ground state calculations performed by the Wien2k framework. The Hubbard corrected generalized gradient approximation (GGA+U) was used to define the electronic and thermoelectric properties. Here we treated the 94 valence electrons per unitcell. Moreover, muffin tin radius of Bi, Fe and O fixed as 2.29, 1.87 and 1.61 respectively such a way that atoms not overlap each other. [9] The wave function basis set were expand up to R mt × K max as 7.0. Furrier expanded charge density fixed as 12 (au−1). We used 500 k-points to optimize the experimental obtained structure. To define the Electronic properties such as density of states and band structure, we performed 1000 k-point for irreducible brilluoin zones. The self-consistence total energy convergent accuracy secured to 10−6 Ry. Thermal conductivity and temperature dependent susceptibility features obtained from Boltztrap code. Here we treat the Fe-atom 3d-orbital as spin nature about to 4eV. [10,11] The energy cut-off set as 10−6 to separate the valance electron from core. To calculate optical properties we used 1000 k-points.
Result and Discussions
The powder X-ray diffraction (XRD) pattern and crystal structure of as-synthesized pure BiFeO3 (BFO) sample is shown in Fig. 1. The diffraction features of the sample (Fig. 1 (a)) shows hexagonal structure with R3c space group. All the peaks well indexed and matches with the single phase BFO according to standard crystallographic data and it consistent to the JCPDS card No. 71-2494. [12] The strong diffraction peaks of the sample (Fig. 1 (a)) suggest good crystalline nature. The 2θ position at 31.723° and 32.021° are found to be highest intensity represent (104) and (110) plane. To further understand the crystal structure and lattice parameters, Rietveld refinement of the powder XRD pattern for as-synthesized BFO (Fig. 1 (a)) was performed using FullPROF Software. A third-order polynomial was employed to integrate the background while the peaks were fitted using a pseudo-Voigt function. [13] The half width of the diffraction peaks as a function of 2θ was estimated by the Caglioti equation. It is to be noted that the simulated XRD pattern (red line BFO calc) is well matched with the experimental XRD peak (red dot BFO obs) as shown in Fig. 1 (a). Moreover, the lattice parameters of 5.633 and 13.933 Å for a and c, respectively, were obtained from the refined structural parameters (Table 1). To demonstrate a successful refinement, the residuals (e.g., weighted profile residual (R wp), profile residual (R p), expected error residual (R e) and structure factor (R f)), associated with the goodness of fit (GOF – (R wp/R e)) and chi2 (χ2), are also listed in Table 1. The low value of GOF and χ2 suggest the XRD pattern is well fitted to the hexagonal phase with R3C structure. Moreover, based on the refined parameters, the observed and calculated 2θ position along with the interplanner distance (d-values) is found to be little shifted, which may be ascribed to the difference in ionic radii. In addition, the crystal structure of as-synthesized BFO sample was visualized using the VESTA program (Fig. 1 (b)).
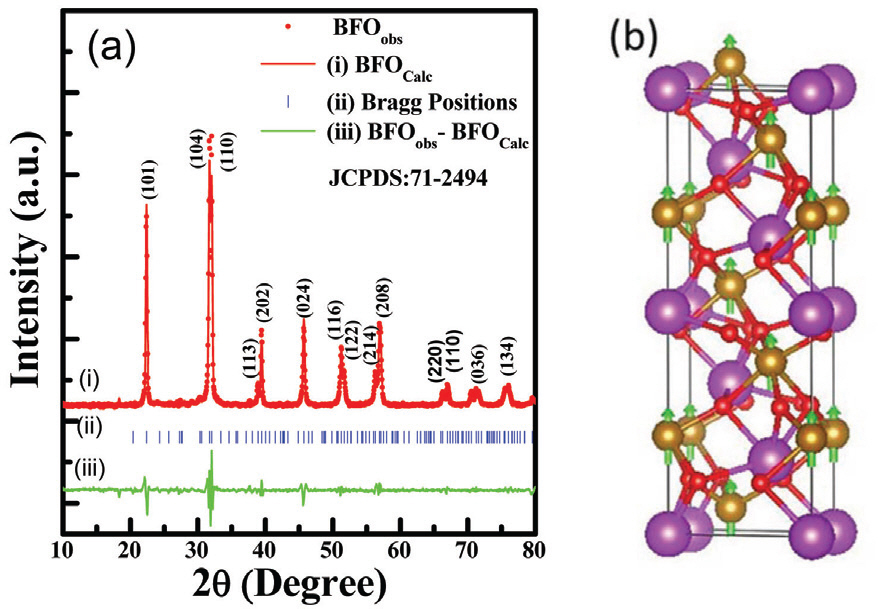
(a) Powder X-ray diffraction pattern with refinement of as-synthesized BFO nanoparticles. (b) Crystal structure of BFO sample with ferromagnetic spin (Purple color sphere indicates Bi atom, golden color sphere is Fe atom, red color sphere shows O atom and green arrow indicates polarization direction).
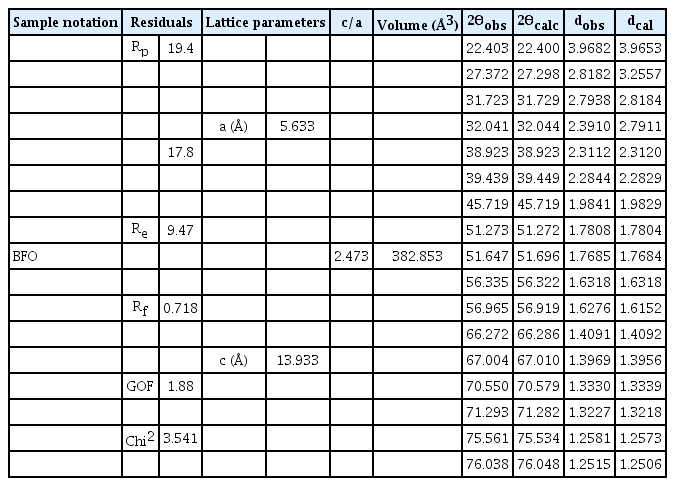
The Rietveld refined parameters and the comparison of observed and calculated 2θ values with respect to interplanner distance (d-value) for as-synthesized BFO.
The electronic structure and bandgap of semi-conductors is essentially linked with the optical absorption properties. The UV-VIS spectra of BFO for absorption from 400 to 700 nm at room temperature is shown in Fig. 2 (a). The sharp enhancement was observed in the UV-Vis spectra above the wavelength of 600 nm, suggesting a considerable absorption of visible light. This suggests a potential use of BFO as a visible-light active photocatalyst. Bandgap of BFO can be estimated from the relation between the absorption coefficient (α) and incident photon energy (hν) near the band edge following,[14]
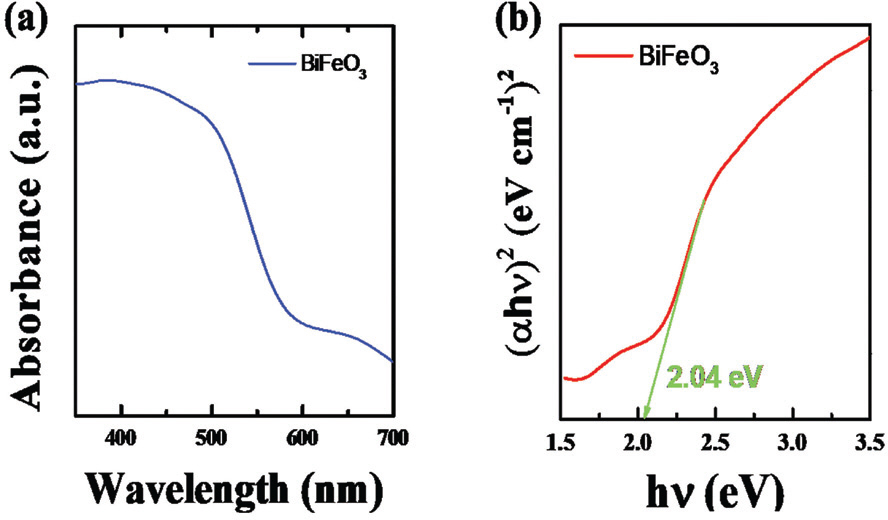
where h is Plank constant, ν is light frequency, and E g is a bandgap. α can be calculated from the experimental UV-Vis spectra. Given that BFO has a direct bandgap, the value of 1 can be used for n. [15] Then, the bandgap of BFO can be obtained by extrapolating the linear plot of (αhν)2 vs. incident photon energy (hν). As can be seen in Fig. 2 (b), the direct bandgap of BFO was calculated as about 2.04 eV which is comparable to the previously reported values. [16] This reveals that BFO has a very narrow bandgap compared to other photocatalytic materials, highlighting its potential use for photoelectrochemical water splitting.
Computational calculations were employed to further study electronic band structure of BFO. Electronic band structure of BFO using DFT with GGA+U method is shown in Fig. 3. Both of spin-up (Fig. 3 (a)) and spin-down (Fig. 3 (b)) states for Fe ion were considered for the calculations. The results indicate that BFO can have both of direct (N–N) and indirect (Г–N, very close to direct with only 0.001 eV higher energy) bandgaps with values of 2.23 and 2.13 eV for spin-up and spin-down states, respectively). The predicted indirect bandgap of BFO, although very close to direct, is contradict with the experimental results. Notably, although an onset absorption starts below the bandgap in the absorption measurement (Fig. 2 (b)), this weak optical transition could be ignored for experimentally determining the bandgap. Thus, the absorption experimental data of BFO results in a direct bandgap for the most of case. [5] Total density of states (t-DOS) of BFO where the Fermi level is set as 0 eV is presented in Fig. 4 (b). Notably, a weak ferromagnetic effect was clearly observed neat at the Fermi level as shown in the inset of Fig. 4 (a). Taking look into partial DOS (p-DOS) plots of BFO, Bi and O have a symmetric p-DOS for spin-up and spin-down states (Fig. 4 (b)), however Fe shows unsymmetrical p-DOS for the two different spin states. The valence band (VB) of BFO is consisted of Fe 3d, O 2p, and Bi 6p states. Additionally, the VB near at the Fermi level is mainly occupied by Fe 3d and O 2p states indicating that a strong hybridization is occurred between Fe and O atoms. In the conduction band (CB) of BFO, it was found that Fe 3d states predominantly occupy the CB in the range from 1 to 4 eV and Bi 6p states mainly occupy above 4 eV. Also, O 2p states are highly mixed with Fe 3d and Bi 6p sates in the CB. Hence, the bandgap of BFO is constructed with Fe 3d and O 2p states at the bottom of CB and the top of VB, respectively. In regard with the strong hybridization between Fe 3d and O 2p states in BFO, charge transfer can occur from the occupied O 2p to the unoccupied Fe 3d states or from VB to CB of the Fe 3d states through the d-d transition. These two different electronic transition routes in BFO can effectively facilitate charge transfer of electron-hole pairs possibly boosting its photocatalytic activity.
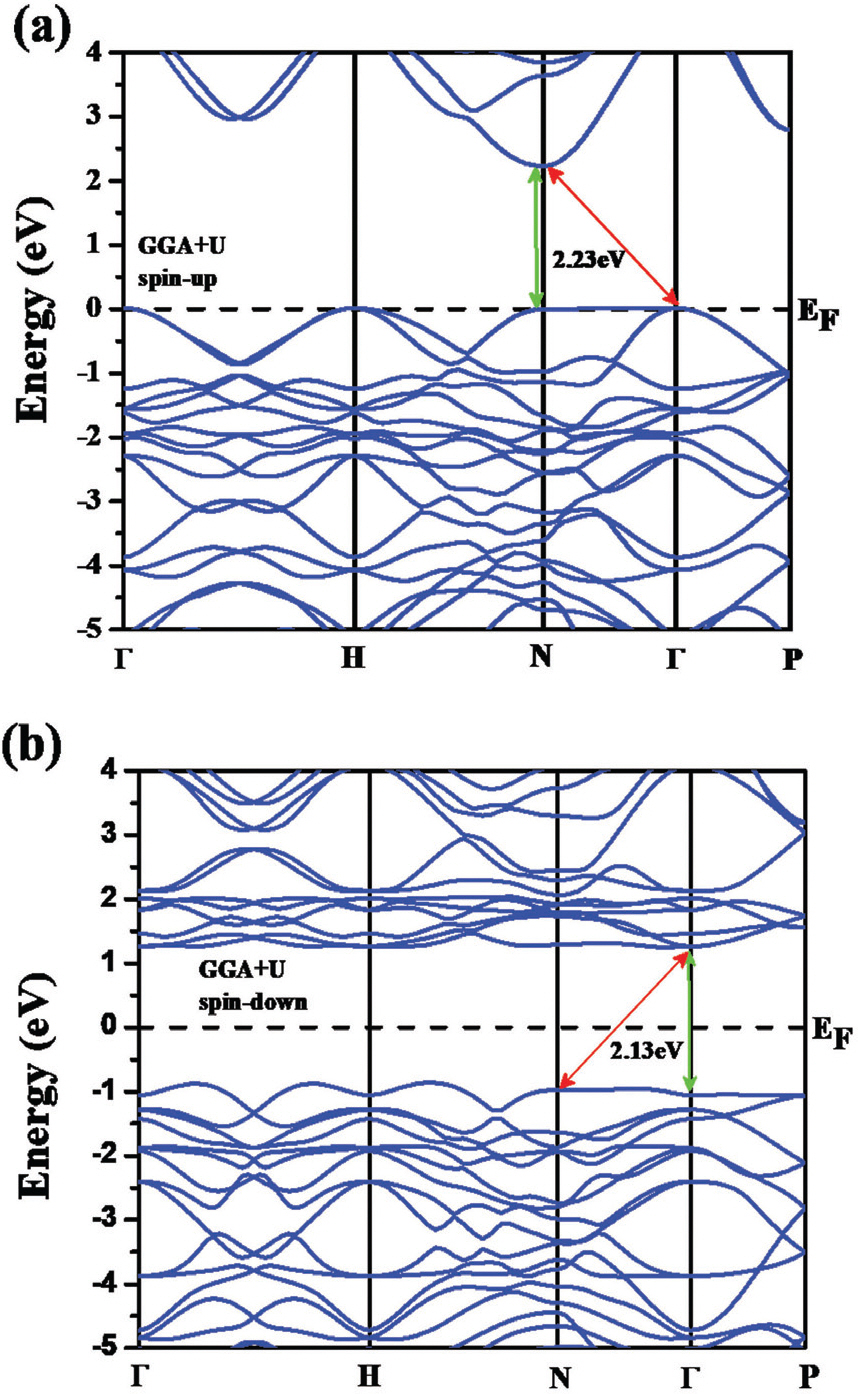
Calcualted band structure of BFO using GGA+U method (a) sping up and (b) spin-down of Fe atoms.

Calculated (a) t-DOS and (b) p-DOS of BFO.
A simulated complex dielectric function of BFO is shown in Fig. 5. Note that ε2 (imaginary part of dielectric function) is essentially related with the electronic band structure where a peak in ε2 vs. energy plot corresponds to a multiple direct or indirect interband transition. The ε2 of BFO was started to increase approximately at 2.0 eV, where the first peak at 2.9 eV can be ascribed to the transitions from O 2p in VB to Fe 2d in CB or the d-d- transition in Fe 3d states. The peaks appeared at higher energy may be attributed to the transition from the occupied O 2p in VB to the unoccupied Fe 3d or Bi 6p states with a higher energy states in CB. Fig. 5 shows a simulation result on the absorption coefficient of BFO as a function of energy. It is found that the simulated absorption spectra of BFO gives a direct bandgap of 2.2 eV which is well consistent with our experimental results.
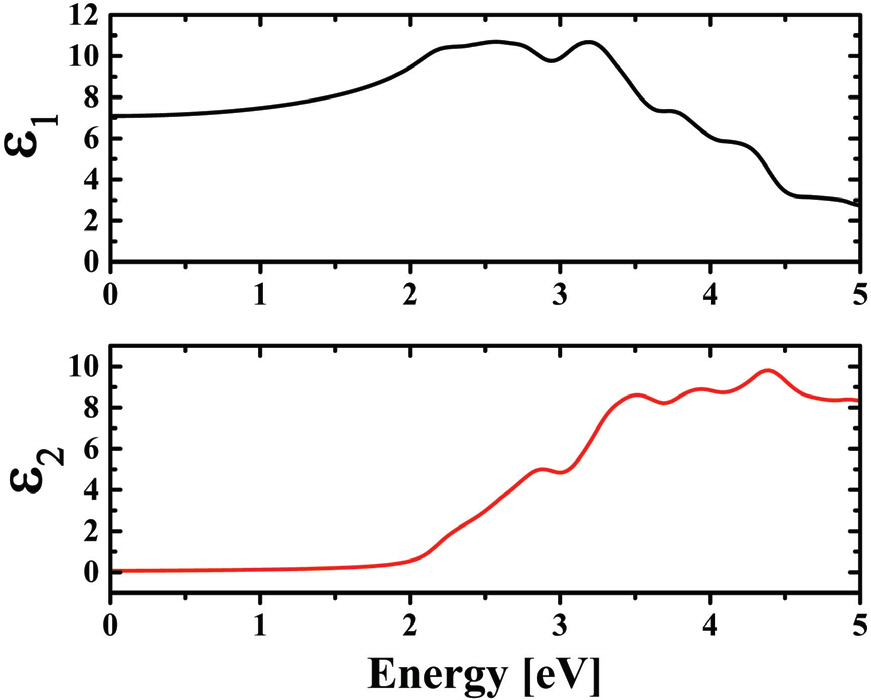
Calculated complex dielectric function of BFO.
Conclusion
In summary, we have studied the electronic band structure of BFO, which was synthesized via a facile sol-gel method. Structural characterization was performed on the synthesized BFO powder by measuring the powder XRD pattern in combination with the Rietveld refinement. Electronic band structure of BFO was studied by experimentally measuring absorption spectra and computationally simulating band structure. The experimental as well as computational results reveal that BFO can have both of direct or indirect (close to direct) bandgaps with a value of around 2.0 ∼ 2.2 eV. Also, the simulated electronic structure of BFO indicated that a weak ferromagnetic effect is existed in BFO. According to the detailed study on DOS plots, electronic transition in BFO can occur via two different routes such as the O 2p to Fe 3d states or the d-d transition in Fe 3d states. The multiple electronic transition way in BFO with a narrow bandgap makes it as a promising photocatalytic material which can effectively absorb visible light.
Notes
Data accessibility
There are no additional data to accompany this manuscript. All relevant datasets are within the main body of the manuscript. All protocols and software used are stated fully in the methodology section. There are no coding lists for this research.
Author contributions
H.H. and A.K.N. conceived the project; H.H. and A.K.N designed the experiments; H.H. and A.K.N wrote the manuscript; G.T., E.R.D., N.K.S, E.E. performed the detailed analysis on the data; G.T., E.R.D., N.K.S, S.J.K. performed the detailed analysis on structural data of the samples; All authors participated in analyzing the data and commented on the manuscript; All authors gave final approval for publication.
Competing interest
There are no competing interests for this manuscript.
Research ethics
No research which needs a local ethic approval is included in this work.
Animal ethics
No animal related experiments are included in this work.
Permission to carry out fieldwork
No field works are included in this work.
Funding
This research was supported by Basic Science Research Program through the National Research Foundation of Korea (NRF) funded by the Ministry of Science, ICT and Future Planning (2018R1D1A1A02085938).
Acknowledgments
Authors thank for Dr. H. Kim for valuable discussion on the manuscript.