금속산화물 기반 반도체식 가스센서의 연구개발 동향 및 전략
Recent Advances and Trends in Metal Oxide-based Semiconductor Gas Sensors
Article information
Trans Abstract
With rapid industrial development, a large amount of waste gases has been produced, causing severe industrial disasters and human health problems. In order to avoid gas-related accidents and prevent potential health issues, the detection and monitoring of hazardous gases is essential. In order to effectively detect harmful gases, semiconductor gas sensors have gained increasing attention due to their high sensitivity, small size, cost-effectiveness and ease of manufacturing. This article reviews metal oxide-based semiconductor gas sensors. Firstly, features of metal oxide-based semiconductor gas sensors including major advantages and limitations are discussed. Then, the operating mechanism of semiconductor gas sensors are discussed with a list of widely studied metal oxides. Finally, the semiconductor gas sensors made of four different metal oxides – i) tin oxide (SnO2), ii) indium oxide (In2 O3), iii) zinc oxide (ZnO), and iv) tungsten trioxide (WO3) – are discussed from the aspects of current challenges, recent research strategies and future perspectives.
1. 서론
문명의 발전에 따라 인간의 의식주 및 삶의 질 향상을 위한 농업과 공업기술은 급격히 발전해오고 있다. 그러나 기술발전과 함께 수반되는 환경오염은 현대 사회가 직면한 가장 큰 문제로 대두되고 있으며, 현대에 이르러 개개인에 특화된 맞춤형 헬스케어에 대한 수요 또한 비약적으로 증가하고 있어 이에 대처하기 위한 기술개발이 활발하게 진행 중이다. 이에 다양한 분야의 산업 발전에 따라 작업환경에서 발생하는 가스 및 화학물질에 의한 산업 재해 문제 방지 및 특정 생체지표 가스의 검출을 통해 빠르고 저렴한 비용의 진단을 가능케하기 위한 연구가 많이 진행되고 있다.[1] 따라서 황화물, 질소산화물, 탄화물, 휘발성 유기 화합물 등 인체에 유해한 특정 산업용 가스 및 특정 생체지표 가스의 존재 여부를 확인함과 동시에 해당 가스의 농도를 정량적 전기 신호로 변환 측정할 수 있는 가스센서가 재해 방지책 및 개인 건강 진단용 소자로써 활용되고 있으며 다양한 연구 및 개발 또한 진행되고 있다 (Fig. 1).[2]
가스센서는 가스 검출 방식에 따라 전기용량식, 광학식, 촉매연소식, 전기화학식, 표면음향파식, 반도체식 등 여섯 종류 혹은 그 이상으로 분류할 수 있는데, 이들 중 전기화학식 가스센서가 높은 내구성 및 측정 신뢰성을 바탕으로 가장 널리 사용되어왔다. 그러나, 전기화학식 가스센서는 큰 크기에 고전력 구동을 바탕으로 작동하며 반응속도가 느리다는 단점이 있다. 이에 작은 크기와 낮은 제작 단가, 공정의 용이성 및 간단한 작동원리 등의 장점을 가진 반도체식 가스센서에 대한 연구가 주목을 받았으나 측정하고자 하는 가스에 대한 선택도가 낮고 상온 작동에서 낮은 가스 감도 등의 단점으로 인해 그 활용이 제한적이었다. 하지만 반도체 재료와 나노 구조 연구의 발전에 따라 여러가지 합성공정을 통해 센서소재의 성능을 향상시킬 수 있는 가능성이 열리며 다양한 물질 및 구조를 활용한 반도체식 가스센서 연구가 각광받고 있다.
반도체식 가스센서는 합성된 가스 감지 재료를 전극 위에 전사하거나 전극 위에 재료를 직접 성장시키는 방식 등을 활용하여 제작한다. 반도체식 가스센서에 사용되는 대표적인 물질은 금속 산화물로서 SnO2, ZnO, NiO, WO3, CuO, In2 O3, TiO2, Fe2 O3, Ga2 O3 등 여러가지 물질을 활용한 연구가 진행되고 있다.[3–5] 다양한 금속 산화물들은 전자빔리소그래피, 수열합성법, 용매열법, 졸-겔법, 스침각 증착법, 펄스레이저 증착법, 화학기상 증착법 등 여러가지 공정을 통해 합성이 가능하며, 그 형태 또한 후막, 박막, 나노선, 나노리본, 나노입자 등 원하는 구조로 제작할 수 있다.[6–8] 가스센서의 성능은 4S – 감도(sensitivity), 선택도(selectivity), 속도(speed), 안정성(stability) – 로 평가할 수 있는데, 측정 대상 가스에 대한 높은 성능을 달성하기 위해 여러 종류의 금속 산화물을 다양한 형태로 제작하는 연구가 진행되었으나 추가적인 성능 향상을 달성할 수 있는 연구에 대한 수요가 지속적으로 증가하는 추세이다.
본 리뷰에서는, 나노 구조화, 복합체 형성, 도핑 등 다양한 방법을 활용한 반도체식 가스센서의 고감도화 및 저전력 구동 관련 연구 동향과 향후 전망에 대해 다루고자 한다.
2. 금속 산화물 기반 반도체식 가스센서의 작동 원리 및 대표 소재
반도체식 가스센서는 센서 구성 소재와 검출 대상 물질의 상호작용에 따른 센서 신호의 변화를 계측하는 간단한 원리를 바탕으로 작동한다. Figure 2. a는 가스센서 물질로 널리 사용되는 센서 소재군인 금속산화물을 기반으로 한 가스센서의 작동 원리를 n형과 p형으로 나누어 설명한 그림이다. n형 금속 산화물 기반 가스센서의 경우 대기 중에서는 산소가 산화물의 결정립 표면에 흡착되며 전자 공핍층(electron depletion layer, EDL)을 형성하고, 그로 인해 생성된 전위장벽에 의해 특정 저항 값을 나타내게 된다. 이때 NO2와 같은 oxidizing gas가 유입되면 산화물 결정립 표면에 흡착되어 있던 산소의 농도가 증가해 전위장벽이 높아져 저항이 증가하며 CO, H2와 같은 reducing gas가 유입되면 반대로 흡착 산소의 농도가 감소해 저항이 감소한다. 반대로 p 형 금속 산화물 기반 가스센서의 경우 산소 흡착은 정공 축적층(hole accumulation layer, HAL)을 형성하며 가스의 종류에 따라 정공 축적층의 두께 변화에 따른 저항변화를 나타내게 된다. 이때 변화된 저항 값과 기존 저항 값의 비율을 백분율로 나타낸 값을 가스 감응도(responsivity) 라고 하며, Fig. 2. b는 측정 대상 가스를 주입하고 기록한 전형적인 형태의 시간에 따른 감응도 변화 그래프를 보여준다. 특정 가스 농도에서 최대 감응도(peak responsivity)값이 클 수록 고감도 센서임을 의미하며, 초기 감응도부터 최대 감응도의 90%에 해당하는 값에 도달하는 시간을 의미하는 응답시간(response time)과 최대 감응도 도달 이후 최대 감응도의 10%에 해당하는 값으로 돌아오는 시간을 나타내는 회복시간(recovery time) 산출을 통해 센서의 반응속도를 나타낼 수 있다. 센서의 최대 감응도는 측정 가스의 농도에 따라 달라지게 되는데, 다양한 가스 농도에 따라 기록한 최대 감응도 값들을 선형 적합한 후 외삽하는 방식으로 이론적 감지 한계(theoretical detection limit)를 구할 수 있다 (Fig. 2. c, d). 특정 가스센서의 성능은 앞서 기술한 4가지 변수들 – 1) 최대 감응도, 2) 응답시간, 3) 회복시간, 4) 이론적 감지 한계 – 을 활용하여 정량화 할 수 있다.
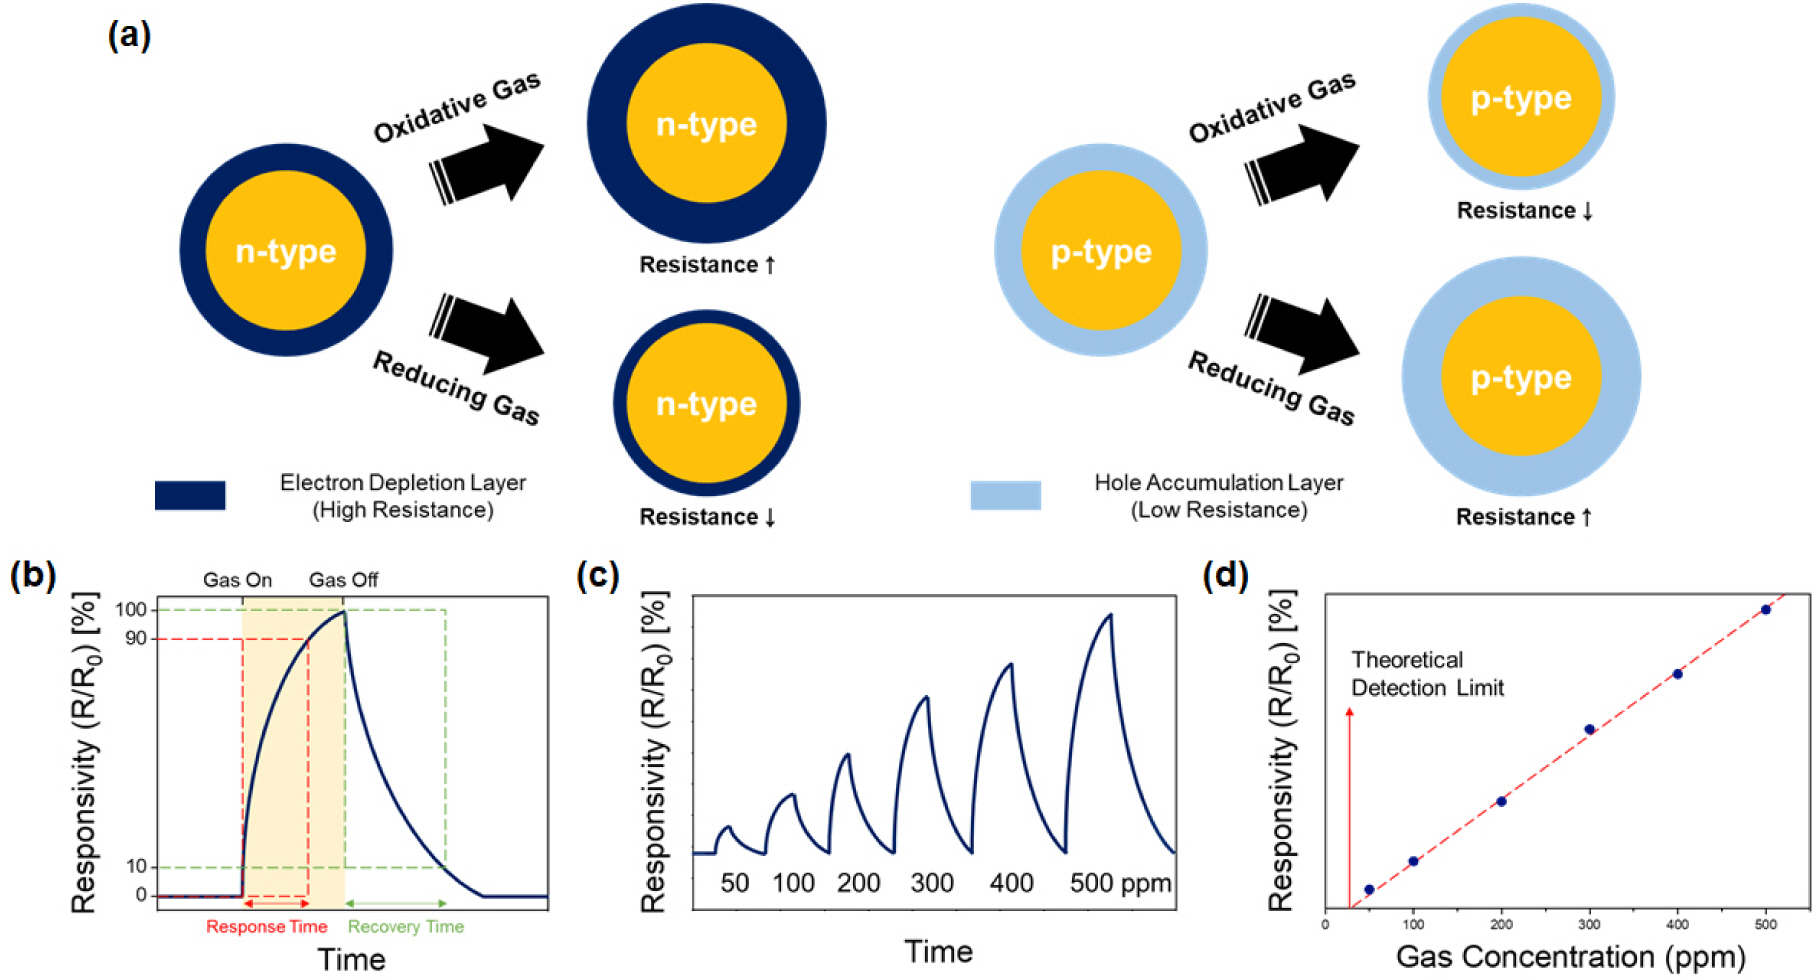
a. Schematic diagram for the gas sensing mechanism of n- and p-type metal oxide, b. typical response-recovery curve of a gas sensor, c. response-recovery curve under different gas concentration, and d. calculated theoretical detection limit
반도체식 가스센서는 작동 원리상 특정 가스에 대한 선택적 감지 능력이 다른 작동방식의 센서에 비하여 좋지 않다. 따라서, 측정하고자 하는 가스에 따라 좋은 감응도를 보여줄 수 있는 다양한 금속 산화물들을 활용한 센서제작과 추가적인 성능향상 및 선택도 개선을 위한 전략들에 대한 연구가 진행되고 있다. Figure 3는 2022년 3월을 기준으로 출판된 물질 별 가스센서 연구 논문의 비율을 나타낸다.[9] 전체적으로 p형 금속 산화물을 이용한 가스센서 연구의 비중은 높지 않으며, SnO2와 ZnO를 필두로 한 다양한 n형 금속 산화물들이 주요 가스센서 소재로서 연구되고 있다.
3. 금속 산화물 기반 가스센서의 물질 별 연구 동향
가스센서에 사용되는 다양한 물질군 중 SnO2, In2 O3, ZnO, WO3, CuO, NiO 등으로 대표되는 금속 산화물은 저렴한 가격 및 공정의 용이성과 더불어 높은 안정성에 기반한 고감도 성능을 바탕으로 유해 가스를 검출하는 물질로써 다양하게 활용된다. 이어지는 장에서는 활발한 연구가 진행되고 있는 네 가지 n형 금속 산화물 기반 가스센서 연구의 동향 및 한계점과 더불어 각 물질이 가지는 단점 개선을 위한 다양한 연구개발 전략에 대해 살펴보고자 한다.
3.1 SnO2
반도체식 가스센서의 대표적인 물질인 SnO2는 3.6 eV의 넓은 밴드 갭, 160·cm2/V*s의 높은 전자 이동도와 더불어 고안정성, 낮은 가격, 쉬운 합성법 등의 장점들을 바탕으로 가장 많은 연구가 이루어지고 있다. SnO2는 후막형 가스센서의 형태로 상용 기기들에 접목되어 오랫동안 연구되어왔지만, 최근 저전력 소형 센서의 수요 증가에 따라 박막형태로 제작되는 연구가 활발히 진행 중이다.[10,11] 그러나, 박막형태의 SnO2에서는 산소가 흡착될 수 있는 가스 흡착 활성 자리(gas adsorption active site) 감소에 의해 필연적으로 센서의 감도가 낮아지는 단점을 갖게 되며, 이미 감소한 활성 자리들을 추가적으로 비 활성시키는 습도에 더욱 취약한 모습을 보인다. 이에 따라 박막 형태로 제작하는 SnO2의 다양한 구조적, 화학적 변형을 통해 센서의 성능과 안정성을 향상시키는 연구가 진행되고 있다. Figure 4은 일본산업기술종합연구소 (AIST)에서 보고한 내용으로 자외선 처리된 전극 기판 위에 90 ℃로 SnF2 수용액을 가열함으로써 SnO2 nanosheet을 직접 성장하여 아세톤 가스에 대한 성능평가를 수행한 연구결과이다.[12] 합성된 SnO2 nanosheet는 합성시간에 따라 아세톤 감응도 차이를 보였는데 6시간 합성한 SnO2 nanosheet (NS-6)가 센서 작동온도 및 아세톤 농도에 관계없이 가장 높은 감응도를 나타냈다 (Fig. 4. b, c). 아세톤 감응도의 차이는 SnO2 합성 시간에 따라 형성된 면 방향 차이에 기인하며, Sn2+의 밀도가 높고 아세톤 분자의 흡착에너지가 가장 낮은 (101) 방향의 SnO2 표면에 우선적으로 흡착됨을 알 수 있다. 6시간 동안 합성한 SnO2에서 (101) 방향의 결정 밀도가 가장 높은 것을 확인하였다. 또한, 해당 SnO2 nanosheet은 낮은 아세톤 농도에서의 감지 선형성 및 높은 아세톤 선택도 (~1,020%)의 좋은 센서 성능을 보여주었다 (Fig. 4. d,e).
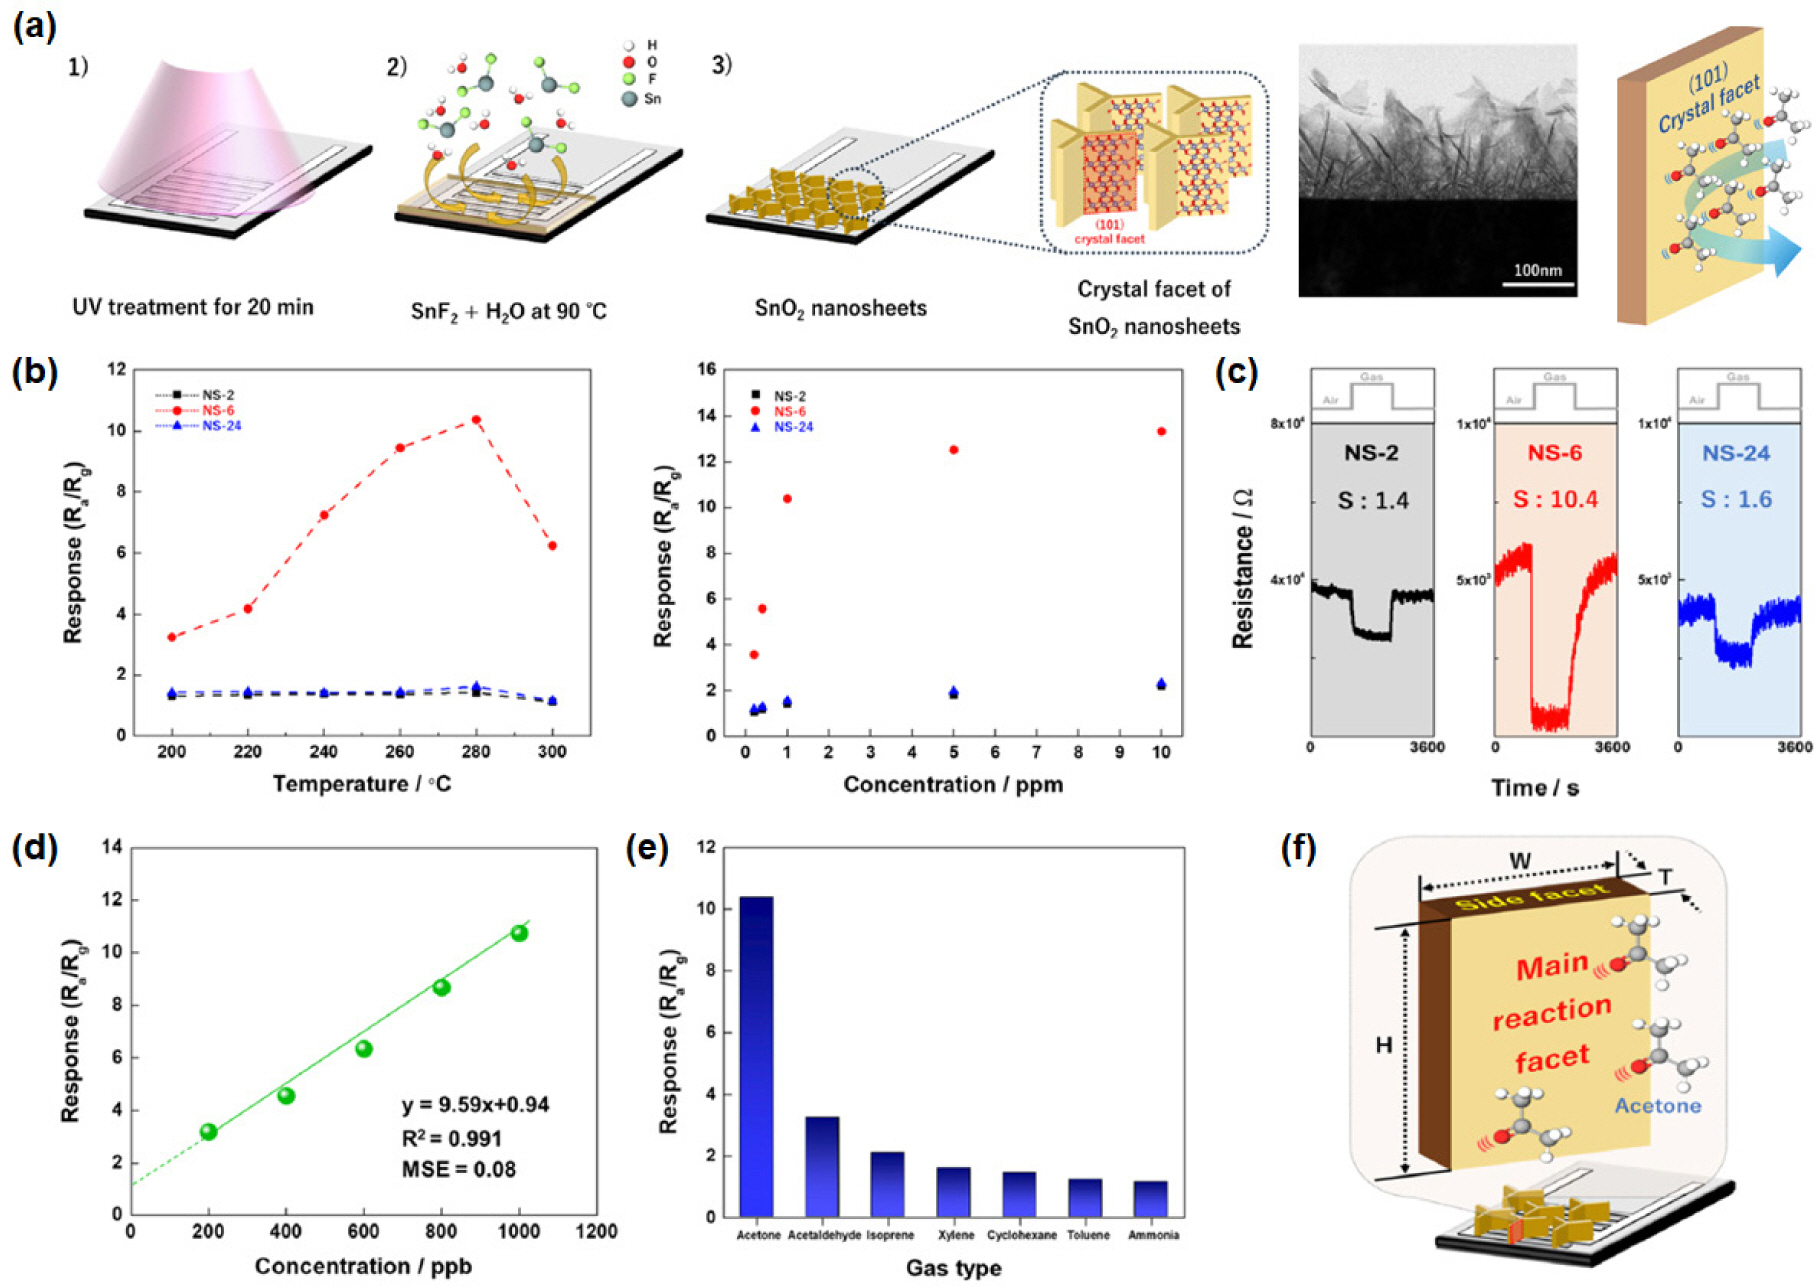
a. Schematic of the synthesis of SnO2 nanosheets on the sensor chip, b. responses of all nanosheet samples toward acetone at various temperatures and concentrations, c. dynamic response of all nanosheet samples at 1 ppm of acetone at the optimal working temperature, d. response of NS-6 from 200 to 1000 ppb, e. responses of NS-6 for 1000 ppb of acetone, acetaldehyde, isoprene, xylene, toluene, and ammonia, and f. schematic of the expected reaction plane on SnO2 nanosheets with dimensions, Reprinted with permission from [12], Copyright (2020) American Chemical Society.
한편, 상하이 대학에서는 팔라듐 - 백금(PdPt) bimetallic nanoparticle을 활용하여 core-shell 구조의 SnO2 microsphere를 제작하고 이를 고감도 포름알데히드 가스센서에 적용하는 연구를 발표하였다.[13] Hydrothermal 방법을 통해 합성한 carbon-based microsphere 템플릿을 SnCl4·5H2 O 용액에 넣어 Sn4+ 이온을 주입한 뒤 열처리하면 shell 형태의 SnO2 microsphere가 만들어지는데 전구체 용액의 농도에 따라 single-shell 및 multi-shell 구조를 만들 수 있으며 추가적인 PdCl2 및 PtCl4의 in-situ 환원을 거치면 bimetallic PdPt-functionalized multi-shell SnO2 microsphere 제작이 가능하다 (Fig. 5. a, b). 해당 연구는 single-shell SnO2 (SnO2-S)와 multi-shell SnO2 (SnO2-M), bimetallic PdPt-functionalized multi-shell SnO2 (PdPt/SnO2-M)의 가스센서 성능비교를 통해 구조 및 촉매 활동을 통한 가스 감응도 향상을 보고하였다. 다양한 온도 구간 및 가스 농도 조건에서 포름알데히드(HCHO)를 측정한 결과 bimetallic PdPt-functionalized multi-shell SnO2가 가장 좋은 감응도 (83.7 % at 190 ℃ for 1,000 ppb HCHO)를 보였으며 가스 선택도 또한 높게 나타났다 (Fig. 5. c-f). 가스 감응도 성능 향상은 다음과 같은 여러가지 요인들의 시너지 효과에 의한 것으로, 1) multi-shell의 높은 비 표면적에 의한 가스흡착/탈착 활성반응자리의 증가, 2) Pt 의 spillover 효과에 따른 산소 분해 및 흡착 촉진에 의한 EDL 두께 증가, 3) 높은 Pd 일함수에 의한 추가적인 EDL 두께 증가, 4) PdPt nanoparticle에 의한 결정 격자구조 활성화가 복합적으로 작용한 결과임이 보고되었다.

a. Schematic diagram of the formation process of PdPt/SnO2-M, b. SEM image of carbon microsphere templates, SnO2-S, SnO2-M, and PdPt/SnO2-M and corresponding EDS mapping of PdPt/SnO2-M, c. response of the gas sensors versus different working temperature to 1000 ppb formaldehyde (HCHO), d. dynamic HCHO sensing transients of the gas sensors, e. relationship between the response of gas sensors and the concentration of HCHO gas, f. selectivity of the HCHO sensors at the optimal working temperature of 190 ℃, and g. schematic illustration of the HCHO gas sensing mechanism, Reprinted with permission from [13], Copyright (2022) American Chemical Society.
3.2 In2 O3
In2 O3는 3.55-3.75 eV 사이의 넓은 밴드 갭, 낮은 비 저항, 높은 전기전도도 등을 바탕으로 가스센서에 활용되기 좋은 특성을 가졌지만, 150 ℃ 이상의 온도에서는 불충분한 확산 채널로 인해 측정 대상 가스의 흡/탈착 평형상태 형성이 불안정하다는 점이 센서 성능향상의 걸림돌로 작용해왔다.[14] 또한, 상온에서의 안정적인 가스 검출에 있어 습도의 영향을 크게 받는다는 것 역시 단점으로 작용한다. 이에 고려대학교에서는 플라세오디뮴(Pr)을 doping한 porous In2 O3 (Pr-In2 O3) sphere를 이용한 높은 습도에서도 아세톤 가스를 안정적으로 감지할 수 있는 가스센서 소재개발 방법을 보고하였다 (Fig. 6).[15] Pr-doped porous In2 O3 (Pr-In2 O3) sphere는 polystyrene nanosphere sacrificial template과 In2 O3의 전구체인 인듐(III) 질산염 수화물 (In(NO3)3·xH2 O)를 활용하여 제작하였으며, 합성 중에 플라세오디뮴 질산염(III) 6수화물 (Pr(NO3)3·6H2 O)을 소량 첨가하고 초음파 스프레이 열분해 방법을 통해 도핑을 진행하였다. 이 연구에서는 Pr doping으로 합성된 In2 O3 sphere의 기공크기 및 구조적 변화는 없었으며, 높은 상대습도 조건에서 가스센서 성능을 향상시킬 수 있음이 확인되었다 (Fig. 6. b,c). Pr-doped In2 O3 sphere는 습도가 없는 조건에서 도핑이 되지 않은 In2 O3 sphere보다 낮은 아세톤 감응도 (~40 % for pure In2 O3, ~9 % for Pr-In2 O3)를 보이지만 80 %의 상대습도 조건에서도 감응도가 유지되는 모습을 보였으며 아세톤에 대한 가스 선택도 또한 유지되는 것이 확인되었다 (Fig. 6. d,e). 해당 결과는 Pr doping으로 인해 생성된 Pr3+와 Pr4+에 의한 좋은 reversible redox 특성에 기인한 것으로 공기 중 수분이 In2 O3 표면에 흡착되며 수산화층이 형성되는 것을 Pr3+의 산화를 통해 억제함으로써 높은 습도저항성을 가질 수 있는 것으로 발표되었다.
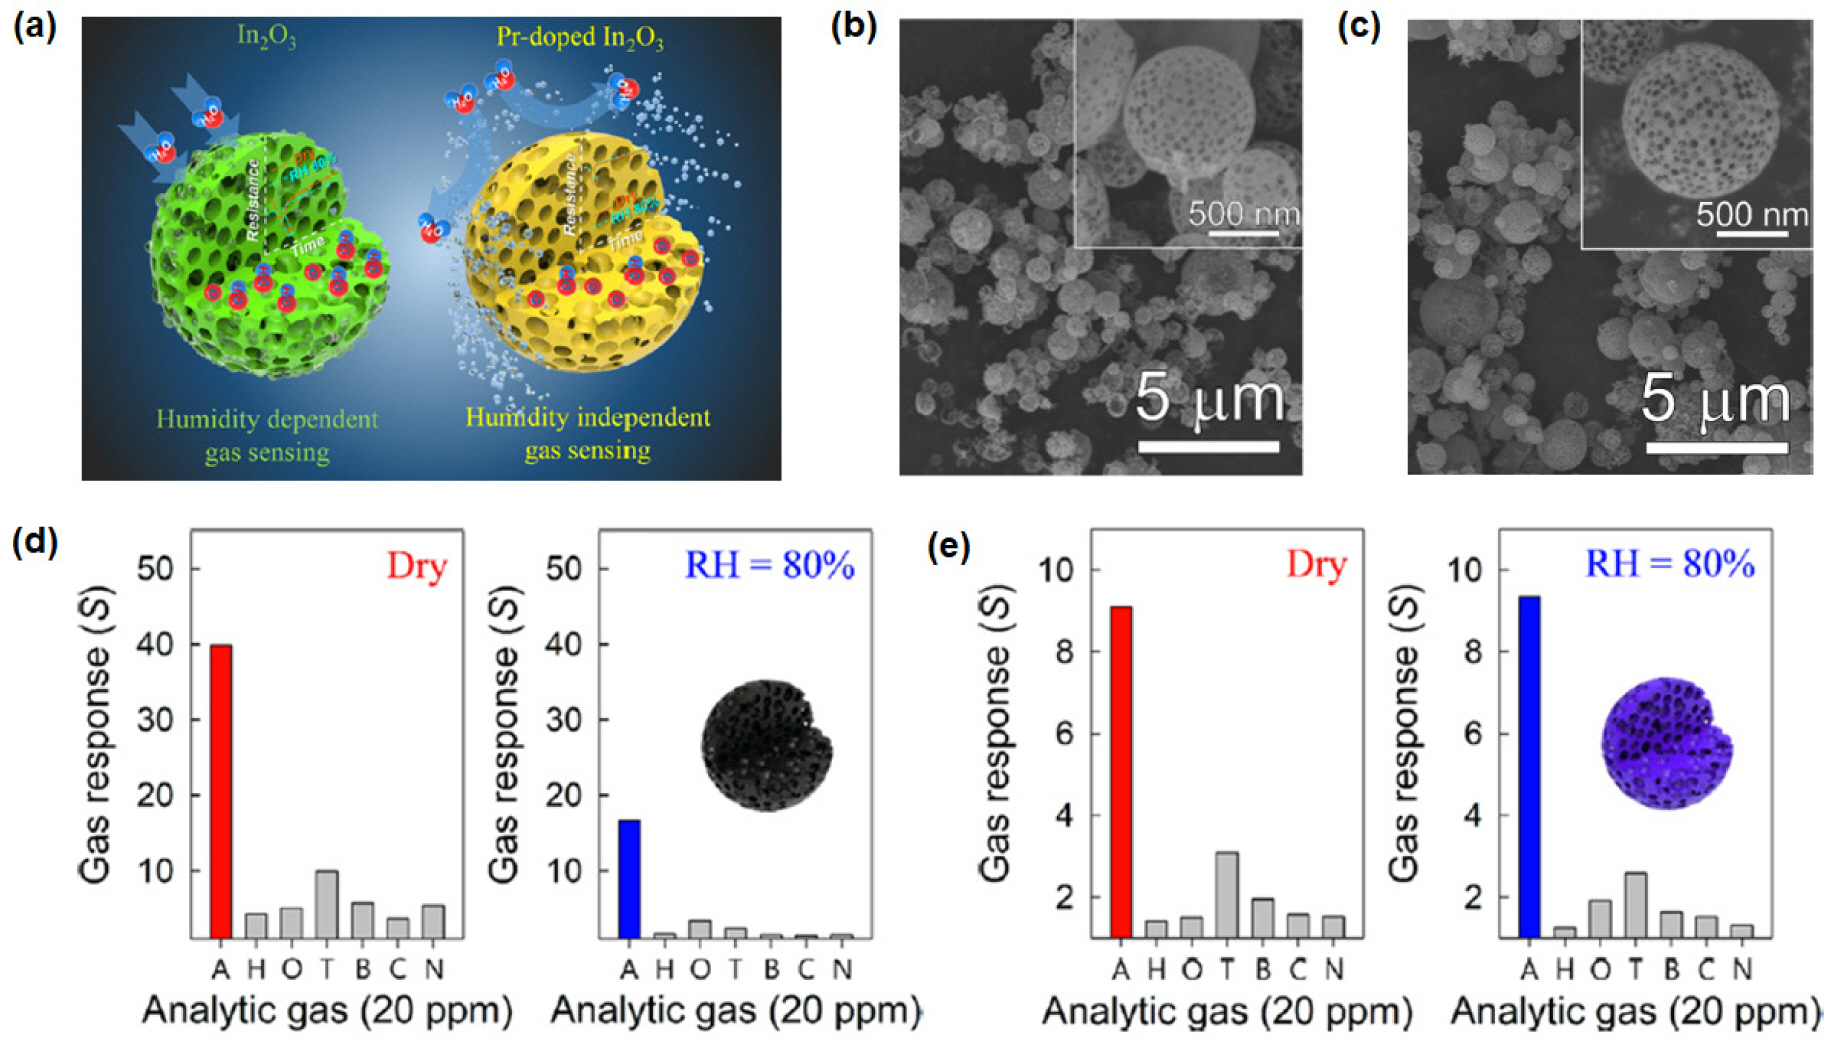
a. Schematic illustration of the humidity resistance of Pr-doped In2 O3 macroporous sphere, b. SEM images of pure In2 O3, c. SEM images of Pr-doped In2 O3, d. gas responses of pure In2 O3 to 20 ppm of acetone (A), hydrogen (H), nitrogen dioxide (O), toluene (T), benzene (B), carbon monoxide (C), and ammonia (N) at 450 ℃ under dry and humid conditions, and e. gas responses of Pr-doped In2 O3, Reprinted with permission from [15], Copyright (2021) American Chemical Society.
또한, Lingmin Yu 그룹에서는 hydrothermal 방법을 이용해 제작한 porous microcube형태의 In2 O3를 활용하여 NO2 가스에 대한 감응도 향상 연구 결과를 발표하였다 (Fig. 7).[16] 해당 연구는 In2 O3의 수열합성 과정에 첨가하는 NH4 F의 양을 조절해 반응 환경의 pH 값을 바꿈으로써 합성 반응 중간 생성물의 종류와 상을 선택해 최종 합성된 In2 O3의 미세구조 최적화가 가능함을 보고하였다. 결과 해석을 위해서 제시한 메커니즘을 살펴보면, 소량의 NH4 F가 첨가된 경우 염기성 환경에서 OH− 이온들로 인해 사방정계(orthorhombic) 구조의 InOOH nanoparticle이 In(OH)3로 합성된 후 최종적으로 In2 O3가 됨으로써 마이크로 큐브 형태를 띄게 된다. 반면, 추가적인 NH4 F 첨가를 통해 산성 환경이 조성되면 HF가 형성됨에 따라 큐브 형태의 In(OH)3 전구체가 etching 되어 다공성 In2O3가 합성됨을 확인하였다. FE-SEM을 통해 관찰한 세 가지 종류의 In2 O3 구조(Fig. 7. a)를 살펴보면 NH4 F가 기공 형성에 있어 중요한 역할을 수행함을 확인할 수 있으며, 과량의 NH4 F를 첨가하면 In2 O3의 구조를 붕괴시켜 microcube 형태가 유지되지 않음을 알 수 있다. 따라서 In2 O3 합성에 첨가하는 NH4 F의 양이 최적화되어야 NO2 가스에 대해 가장 높은 감응도 (~2400 % at 150 ℃ for 1.8 g NH4 F)를 보일 수 있음이 확인되었다 (Fig. 7. b). 이러한 합성결과는 microcube 형태를 유지한 다공성 구조에서 가스 흡착/탈착 반응자리가 증가하고, 이에 따라 확산채널이 확대되면서 센서성능이 향상될 수 있음을 보여준다. 다공성 In2 O3는 높은 가스 감응도와 더불어 NO2 가스에 대한 높은 선택도를 보여주나, 높은 습도 환경에서는 수화물 층의 형성을 억제할 수 있는 별도의 메커니즘이 존재하지 않아 감응도가 소폭 감소함을 확인할 수 있다 (Fig. 7. c-e).
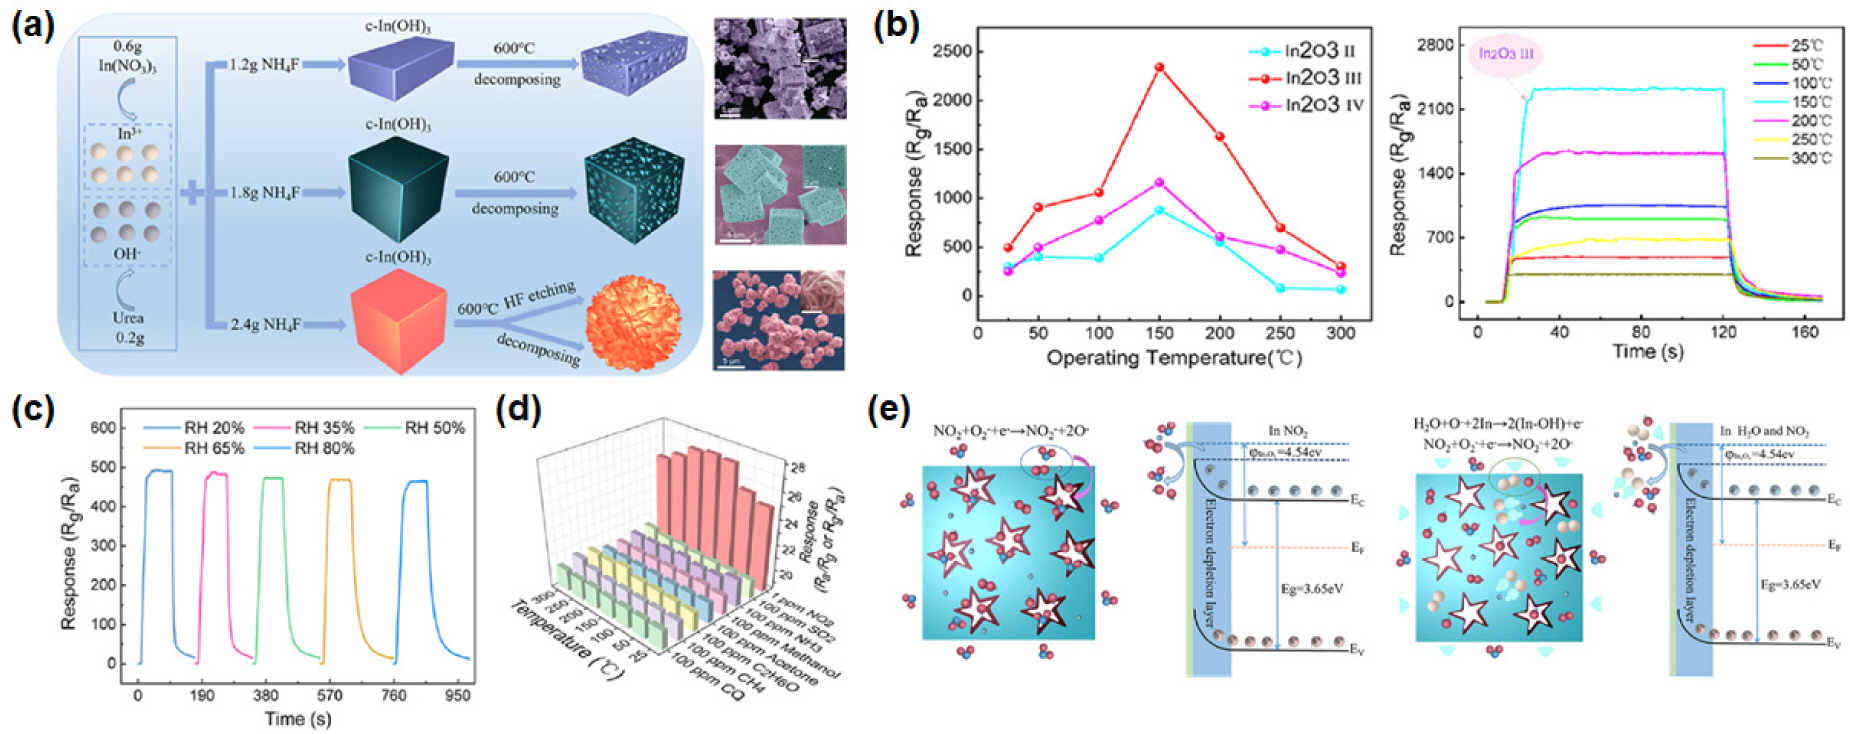
a. Schematic illustrations for the evolution of porous In2 O3 architectures using different masses of NH4 F with corresponding FE-SEM images, b. gas response versus operating temperatures for various gas sensors exposed to 50 ppm NO2 and response curves of In2 O3 III, c. dynamic gas-sensing transients of the In2 O3 III sensor to 50 ppm NO2 as a function of humidity at room temperature, d. selectivity of the as-made In2 O3 III sensor, and e. schematic illustrations of the gas-sensing mechanism and the energy band structure at the surface of In2 O3, Reprinted with permission from [16], Copyright (2021) American Chemical Society.
3.3 ZnO
Zinc oxide(ZnO)는 약 3.37 eV의 밴드 갭, 60 meV 의 exition binding energy와 높은 전자 이동도를 가진 n형 금속 산화물로, 무독성, 높은 화학적 안정성 및 전기적 특성을 바탕으로 NO2 가스 검출에 널리 사용된다.[17] 특히, ZnO는 다른 금속 산화물과 비교하여 이방성 결정 구조, 좋은 대기압 하 반응성, 비 화학양론적 결함구조 등을 보이기에 가스 감응도 및 선택성 향상이 용이하다는 장점을 활용한 다양한 연구가 진행되어왔다.[18] 대표적으로는 나노막대, 나노선, 나노리본 등 다양한 형태의 나노 구조화를 통해 흡착면적을 증가시켜 감응도를 향상시키는 연구들이 많이 보고되었으며, 최근에는 다른 물질과 접목한 composite 및 heterostructure 형성을 통해 가스 감응도를 향상시키는 연구가 활발히 진행 중이다.[19] Tong Zhang 그룹에서는 ZnO와 SnO2의 헤테로 구조체를 reduce graphene oxide (RGO) 위에 합성하여 제작한 가스센서가 높은 NO2 가스 선택도, 준수한 감응도 및 빠른 반응성을 달성한 결과를 보고하였다.[20] 해당 가스센서 소재는 hydrothermal 방법과 wet-chemical deposition방법을 통해 합성하였으며, ZnO/SnO2-RGO 박막을 교차전극 위에 전사하여 가스센서를 제작하였다 (Fig. 8. a, b). 보고된 NO2 가스에 대한 감응도 측정 결과로부터, heterostructure를 활용하였을 때 SnO2나 ZnO 단일물질을 활용했을 때보다 종합적인 감응도, 반응 및 회복속도 (response time of 33 s, recovery time of 92 s), 선택도 (~140 % for 5 ppm NO2)에서 가장 준수한 성능을 보임을 확인할 수 있었다 (Fig. 8. c,d). 이 연구결과에서는 SnO2 또는 ZnO 단일 물질이 RGO 위에 도포된 경우, RGO의 높은 전기전도도에 의해 상온에서의 NO2 감지 성능이 증가한다는 기존 연구결과 이후 SnO2와 ZnO를 함께 사용하여 추가적인 n-n 헤테로 구조체를 형성하는 후속 연구 내용을 소개하고 있다.[21] 또한, ZnO 와 SnO2의 일 함수 차이로 인해 계면에서의 전하 EDL 및 HAL층의 형성과 함께 활성 자리 증가가 센서 성능을 향상시킬 수 있음이 보고되었다.

a. Schematic illustrations for the evolution of porous In2 O3 architectures using different masses of NH4 F with corresponding FE-SEM images, b. gas response versus operating temperatures for various gas sensors exposed to 50 ppm NO2 and response curves of In2 O3 III, c. dynamic gas-sensing transients of the In2 O3 III sensor to 50 ppm NO2 as a function of humidity at room temperature, d. selectivity of the as-made In2 O3 III sensor, and e. schematic illustrations of the gas-sensing mechanism and the energy band structure at the surface of In2 O3, Reprinted with permission from [16], Copyright (2021) American Chemical Society.
또한, 산동이공대학교에서는 ZnO nanofiber에 Ag nanoparticle을 성장시켜 가스센서 성능을 향상시킨 연구를 발표하였다 (Fig. 9).[22] Ag-ZnO 나노 입자는 전기방사를 통해 제작한 Ag-ZnO의 전구체 nanofiber를 열처리로에서 calcination하여 제작하였으며 다양한 농도의 Ag를 포함한 Ag-ZnO 나노 입자들을 활용한 가스센서 성능을 측정하여 그 특성을 보고하였다 (Fig. 9. a). 3 %의 Ag가 doping된 Ag-ZnO 나노 입자로 제작한 가스센서에서 가장 높은 에탄올 및 황화수소 감응도 (~150 % at 320 ℃)를 확인하였다 (Fig. 9. b,c). 해당 가스센서는 2 ppm의 저 농도 에탄올도 효과적으로 검출할 수 있었으며, 최적화된 측정 온도인 120 ˚C 조건에서 준수한 에탄올 감지 능력과 함께 압도적인 황화수소 선택성 (~300 % for 3 % Ag-ZnO)을 나타냈다 (Fig. 9. d,e). 전반적인 감응도 증가는 Ag 입자의 spillover 효과에 의해 두꺼워진 EDL층 및 Ag 표면의 증감(sensitization) 효과로 인한 추가적인 산소 흡착에 바탕을 둔다. 또한, 황화수소에 대한 압도적인 선택성의 경우, 흡착 산소와 더불어 ZnO와 직접 반응하여 ZnS를 형성하는 황화수소 가스의 특성에 의한 것이라고 보고하였으며, 에탄올에 비하여 낮은 반응속도 또한, ZnS 표면을 형성하는 반응에 인한 것으로 보고하였다.
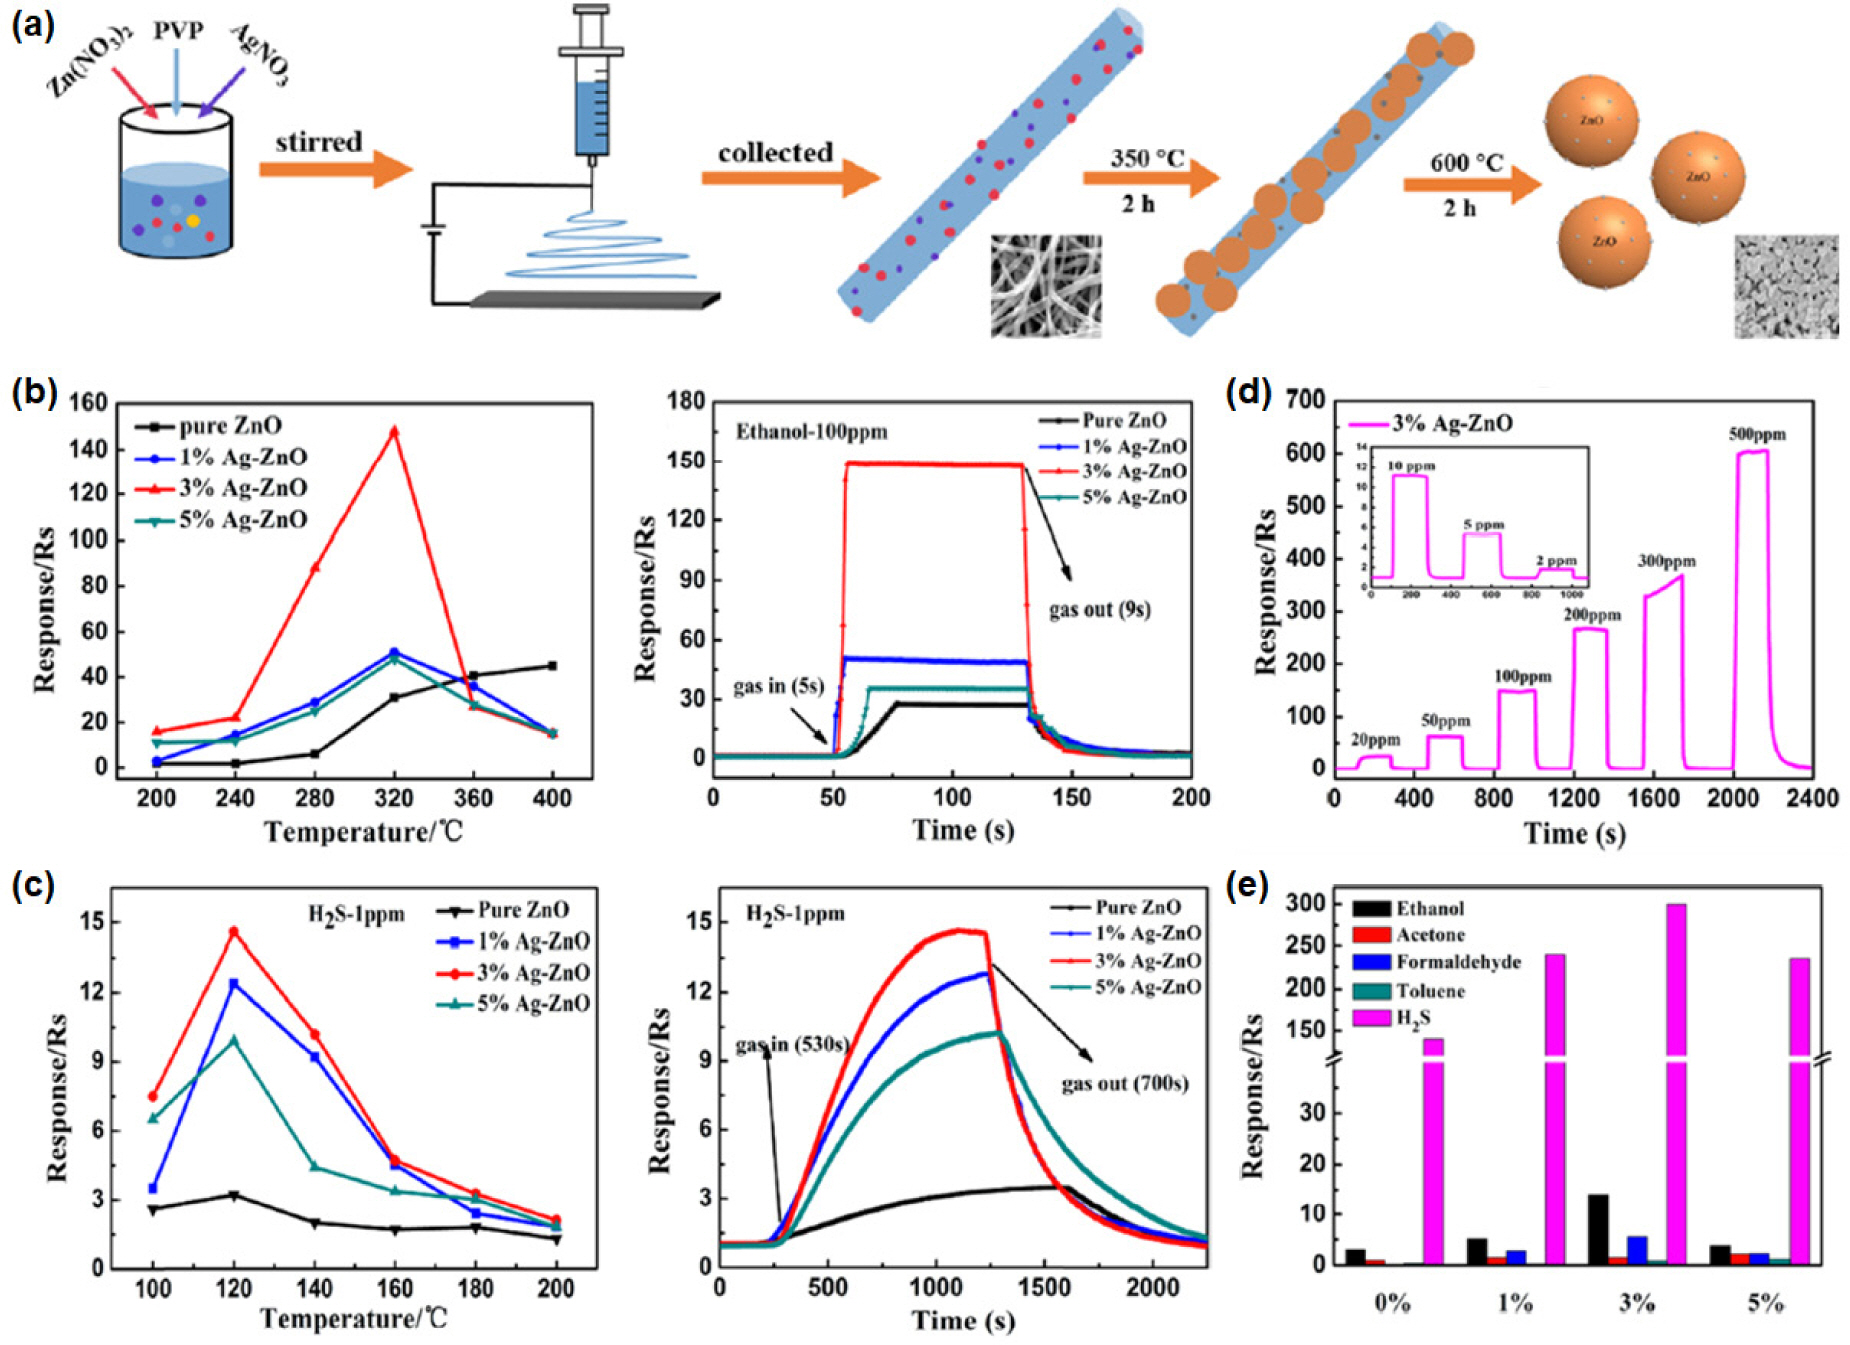
a. Schematic illustration of the preparation of Ag-ZnO nanoparticles, b. response of the sensors to 100 ppm ethanol under different operating temperatures and response/recovery curve of the sensors at 320 ℃, c. response of the sensors to 1 ppm H2 S under different operating temperatures and response/recovery curve of the sensors at 120 ℃, d. response curves of the 3% Ag-ZnO sensor toward 20-500 ppm ethanol at 320 ℃, and e. response of pure ZnO and 1%-5% Ag-ZnO sensors exposed to 10 ppm of gases at their optimum operating temperature, Reprinted with permission from [22], Copyright (2019) American Chemical Society.
3.4 WO3
빠른 반응속도와 높은 착색 효율 등의 장점을 가진 WO3는 안정적 물리화학적 특성과 함께 상전이를 보여주는 다형성(polymorphic) 소재로 광 촉매, 다양한 전기 화학 장치 및 가스센서에 사용되는 물질로써 다양하게 연구되어왔다.[23,24] WO3는 W6+ 이온의 5d 껍질이 비어 있기 때문에 산화 또는 환원 반응 중 원자가가 바뀌게 되므로 oxidizing 및 reducing gas 검출에 있어 높은 감응도를 보인다.[24] 또한 WO3는 다른 금속 산화물들과 비교해 극한 측정 조건 또는 상온에서 높은 감응도를 보이기 때문에 추가적인 감도 향상을 위한 연구가 활발히 진행되고 있으나 상온 저전력 구동 시 감응도, 선택도, 반응 및 회복시간, 측정 재현성이 모두 감소하는 단점이 있다.[23,24] 한국과학기술연구원에서는 Rhodium 을 첨가한 WO3 nanorod에서 구조적 변화 및 헤테로 구조화에 의한 아세톤 감지 성능 향상을 보고하였다 (Fig. 10).[25] 전자빔 증발기에서 glancing angle deposition (GAD) 증착을 통해 합성한 WO3 나노 막대 구조 위에 Rhodium을 다양한 두께로 추가 증착하는 방법을 고안하였다. 에탄올과 아세톤에 대한 감응도를 측정한 결과, 0.5 nm의 Rhodium을 증착한 WO3에서 가장 높은 센서 성능 (~1500 % for ethanol, ~8000 % for acetone)이 확인되었으며 해당 WO3 nanorod 기반 가스센서는 높은 아세톤 선택도 및 측정 안정성을 나타냈다 (Fig. 10. a-e). Rhodium이 WO3 nanorod에 증착되면 계면에서의 p-n 헤테로 구조 형성에 따라 표면 확산 억제와 전하 트래핑 효과에 의한 표면 구조 변형이 일어나게 된다. 또한, 표면의 증감(sensitization) 효과로 인해 센서의 감지 능력이 향상되게 된다 (Fig. 10. f). 특히 Rhodium 증착된 WO3 가스센서는 아세톤이 Rhodium과 직접 반응함으로 인해 추가적인 산소의 흡착이 일어나며 높은 아세톤 감응도를 보인다.

a. Illustration of Rh-decorated WO3 nanorods with the SEM image and corresponding energy band diagram, b. response transients of Rh-decorated WO3 nanorods with different Rh contents to 5 ppm of CH3 COCH3 and C2 H5 OH at 300 ℃, c. polar plots depicting responses to various gases (5 ppm) at 300 ℃, d. gas sensing repeatability of Rh-decorated WO3 nanorods, e. long-term stability of gas sensing repeatability of Rh-decorated WO3 nanorods, and f. schematic illustration of p-n heterojunctions, Reprinted with permission from [25], Copyright (2019) American Chemical Society.
인도의 Guru Nanak Dev대학교에서는 p형 MoS2와 n형 WO3의 heterostructure 기반 고감도 암모니아 가스센서 연구결과를 보고한 바 있다.[26] 2차원 소재와 3차원 금속 산화물과의 접합은 최근 다양한 물질을 활용하여 그 연구결과가 보고되고 있으며, 상온에서 작동할 수 있는 가능성을 열고 있다.[27] 프로브 초음파 분산을 통해 제작한 MoS2-WO3 전구체를 열처리하여 합성한 헤테로 구조체는 MoS2 및 WO3 단일 물질과 비교해 향상된 암모니아 감응도 (~70 %)와 준수한 반응 (100 s) 및 회복속도 (75 s)를 보였으며 1 ppm의 저농도 암모니아 또한 안정적으로 감지하였다. (Fig. 11. a-e). 이러한 센서 성능 증가는 제작된 복합체의 높은 비 표면적에 의한 가스 흡착/탈착 반응자리 증가와 함께 MoS2-WO3 계면의 p-n heterojunction 형성에 따른 추가적인 활성 자리 증가에 기인한 것으로 설명할 수 있다. Density functional theory (DFT) 계산 결과를 통해 heterojunction 계면에서의 charge transfer 증가가 센서 성능 및 암모니아 선택도 향상에 기여하였음을 증명하였다. 하지만 MoS2-WO3 heterojunction은 습도에 따른 감응도 감소를 보이며 추가적인 습도 저항성을 위한 메커니즘의 필요성을 시사하였다 (Fig. 11. f).
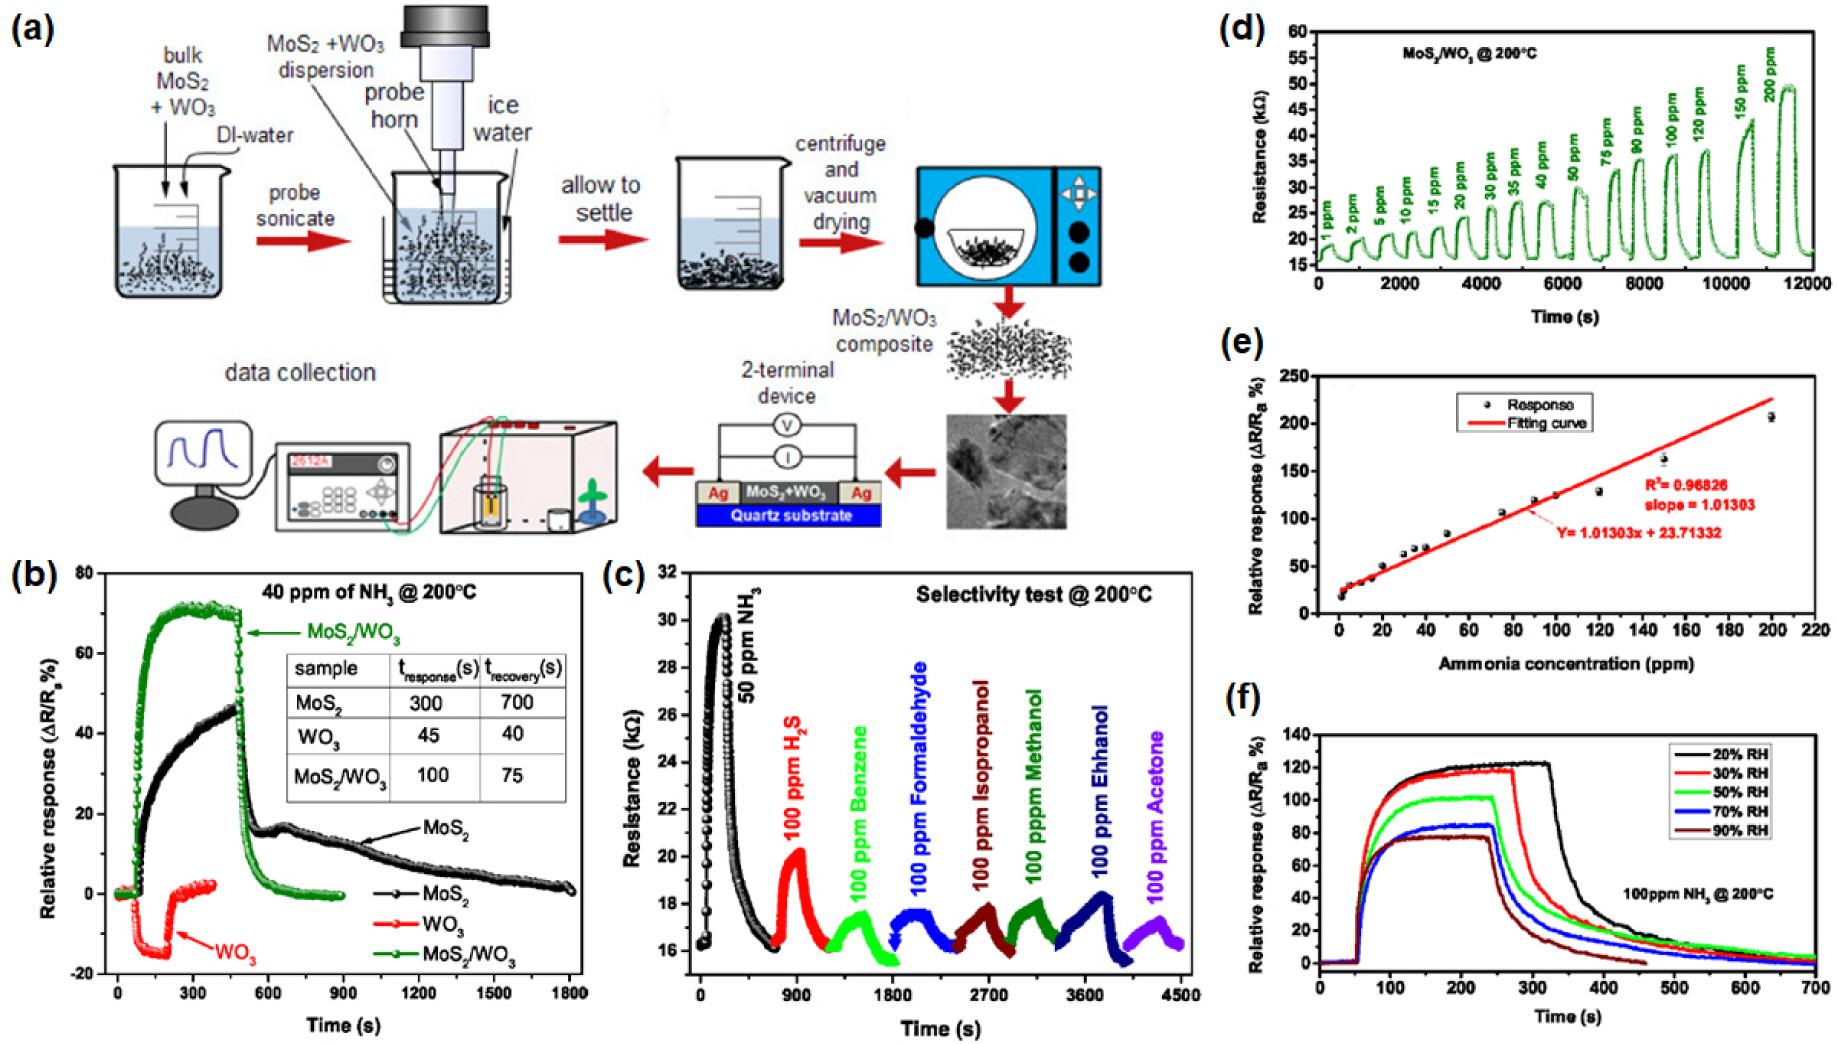
a. Schematic displaying the various steps involved in preparation of MoS2/WO3 composite and data acquisition, b. relative response of two-terminal devices made from MoS2, WO3, and MoS2/WO3 (1:1) composite, c. selectivity test of the MoS2/WO3 composite based sensor, d. variation in resistance of the MoS2/WO3 (1:1) composite sensor to various ammonia concentrations at 200 ℃, e. relative response versus ammonia concentration, and f. sensor response variation with humidity for 100 ppm of ammonia, Reprinted with permission from [26], Copyright (2019) American Chemical Society.
3.5 MEMS-based approaches: Sensor arrays with micro-heaters and LEDs
앞서 소개한대로 금속 산화물을 이용한 가스센서의 특성이 도핑, 나노 구조화, 복합체 형성 등의 다양한 전략을 통해 대폭 개선되었지만, 실제 사용환경에서의 안정적인 가스 감지를 위해서는 높은 작동 온도가 여전히 요구되며 그에 따라 높은 소비전력 소모가 상용화의 걸림돌이 되고 있다. 따라서 센서 물질의 특성 향상 연구와 함께 가스센서 소자의 고감도화 및 저전력화 연구 또한 활발하게 진행되고 있다. 한국과학기술원에서는 ZnO 나노선과 마이크로 LED를 접목하여 제작한 고감도 저전력 가스센서를 보고하였다 (Fig. 12).[28] ZnO 나노선들은 수열합성법을 통해 마이크로 LED 위에 직접 합성되었으며 다양한 크기의 LED 플랫폼을 사용한 결과 크기가 가장 작은 30 × 30 μm2 LED 플랫폼(30-μLP) 에서 가장 좋은 NO2 가스 감응도와 낮은 소비 전력이 확인되었다 (Fig. 12. a-c). 또한 해당 가스센서는 14.9 ppb의 낮은 이론 감지 한계와 준수한 습도 저항성 및 가스 선택도를 나타내어 실질적인 활용 가능성을 보였다 (Fig. 12. d-f). 저자는 30-μ LP에서 확인된 성능 향상이 작은 소자 크기로 인한 소비전력 감소와 함께 광원과 센서 물질의 근접성 (~500 nm) 및 향상된 광균일도에 기인한다고 설명한다.
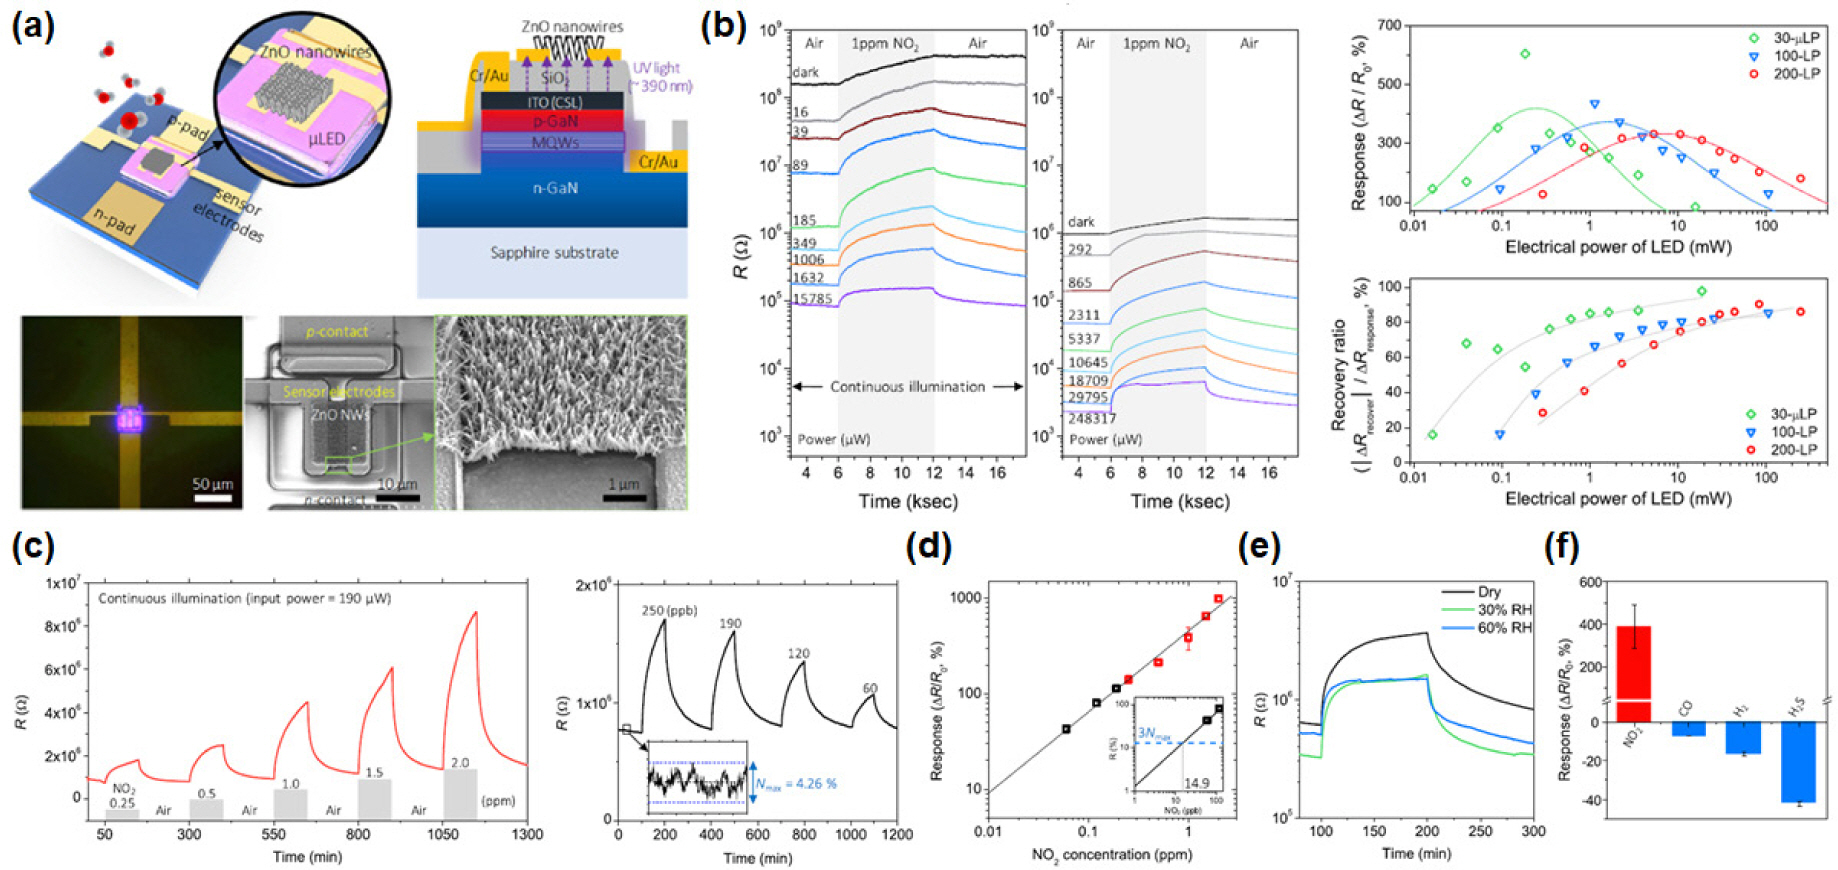
a. Schematic illustration of the photoactivated gas sensors on a micro-LED platform with optical microscopic image of a turned-on device and SEM image of synthesized zinc oxide nanowires, b. responses of photoactivated gas sensors to 1 ppm NO2 gas under different input electrical powers, c. NO2 sensing performance of the photoactivated gas sensor, d. calibration graph of normalized sensor response to NO2 concentrations, e. humidity interference test under 30 and 60% relative humidity and 1 ppm NO2 gas, and f. gas selectivity test to 1 ppm NO2, 160 ppm CO, 3.2% H2, and 10 ppm H2 S, Reprinted with permission from [28], Copyright (2020) American Chemical Society.
다양한 물질들로 제작된 가스센서를 마이크로 히터와 함께 array 형태로 구성하여 가스 감지 성능을 향상시킨 결과를 한국과학기술연구원에서 2021년 발표하였다 (Fig. 13).[29] E-beam evaporator를 통해 제작한 In2 O3와 WO3 nanorod를 사용하여 Pt, Pd, Au를 금속 입자 촉매로 활용해 제작한 2×4 센서 array를 히터와 결합하여 다양한 온도 조건에서 호기에 포함된 대표적인 세 종류의 biomarker 가스에 대한 감응도를 측정한 결과 각기 다른 온도에서 최적화된 가스 감지 성능을 확인할 수 있었다 (Fig. 13. a,b). 나노막대들로 구성된 해당 가스센서는 다공성 구조와 함께 다양한 촉매의 spillover 효과에 의해 향상된 감응도를 보이는데 센서 물질 및 촉매의 종류에 따라 가스 선택도가 달라지므로 다양한 가스센서의 조합을 통해 전반적인 가스 감지 성능을 향상시킬 수 있음이 확인되었다 (Fig. 13. c)

a. Schematic illustration and optical image of the 2 × 4 sensor array with sensor, back heater, chip carrier and Au wires, b. response of the 2 × 4 sensor array to 10 ppm CH3 COCH3, 1 ppm NO2 and 1 ppm H2 S vs. a wide range of operating temperatures, and c. gas sensing mechanisms, Reprinted with permission from [29], Copyright (2021) Creative Commons Attribution (CC BY) license.
4. 결론
전세계적인 에너지 난 및 고효율화 기조에 따라 저전력 작동이 가능한 고감도 및 고선택성 가스센서에 대한 수요가 늘어나고 있는 추세이다. 이에 따라 금속 산화물 기반 반도체식 가스센서에 대한 연구가 큰 관심을 받고 있으며, 주요 단점인 상온에서의 낮은 감응도와 습도 저항성을 해결하기 위한 다양한 연구 개발이 이루어지고 있다. 현재 나노입자, 나노선, 나노막대 등과 같은 나노 구조화를 통해 비표면적을 증가시켜 감응도를 증가시키는 나노 구조화 전략과 더불어 촉매, 헤테로 구조화, 복합체 형성 등의 추가적인 접근 및 소자 구조의 개선을 통해 가스센서의 특성 향상을 달성하려는 연구가 활발히 보고되고 있으며 실 작동 환경 내 특성 향상을 통한 고성능 저전력 가스센서 개발 관련 연구들이 지속적으로 성장하고 있는 중이다. 따라서 다양한 종류의 금속 산화물 및 제작 방법을 활용한 연구들은 앞으로의 저전력 감도 가스센서 개발의 연구 방향성 확장에 크게 기여할 것으로 생각된다.
Acknowledgments
This work was supported by the National Center for Materials Research Data (NCMRD) through the National Research Foundation of Korea (NRF) funded by the Ministry of Science and ICT (NRF-2021M3A7C2089748) and supported by Characterization platform for advanced materials funded by Korea Research Institute of Standards and Science (KRISS – 2022 – GP2022-0013)
References
Biography

◉◉이 선 호
◉ 2013년Washington Universityin St.Louis, 기계공학 학사
◉ 2014년Washington Universityin St.Louis, 기계공학 석사
◉ 2014년 University of Illinois at Urbana-Champaign, 항공우주공학 박사과정
◉ 2020년 한국표준과학연구원 위촉연구원

◉◉권 기 창
◉ 2012년 중앙대학교 화학신소재공학부 학사
◉ 2014년 중앙대학교 화학신소재공학부 석사
◉ 2018년 서울대학교 재료공학부 박사
◉ 2018년 싱가포르국립대학교 박사후연구원
◉ 2021년 한국표준과학연구원 선임연구원

